The Complete Blood Count
See completely with the Minimum DataBase
While a Complete Blood Count (CBC) rarely gives us a specific diagnosis, it is very sensitive and often provides the first indication of illness in a patient. The CBC contains important objective data related to the general health status of the patient. When combined with a history and physical exam, the hemogram can tell us if a patient is anemic, dehydrated or is polycythemic. A Complete Blood Count also allows us to see if the leukogram indicates stress and/or inflammation in our patient. The platelets level helps us understand the patient’s ability to clot properly and may lead us to do further tests before we make the final diagnosis. When collected serially, we can trend CBC data to characterize the severity of a disease’s process and monitor its progression or regression.
Why is the Complete Blood Count an integral part of the Minimum DataBase?
The Complete Blood Count is an essential part of the Minimum DataBase. It is the most sensitive test for identification of deviation from health, that not only supports the owner’s complaint that their pet is “symptomatic” but also justifies further diagnostic investigation. The CBC differentiates between simple stress from potential local or systemic inflammation -potential “stress” of underlying occult non-inflammatory disease or home/environmental changes. If inflammatory in nature, characterizing the type and severity of the inflammatory process. The Complete Blood Count is an highly objective test for characterization of progression or regression of a disease and recognition of progressive chronic disease when previous data are available. Lastly, it helps monitoring the impact of the treatment of a defined disease process – “is my treatment working?”
Interpreting the CBC results
The Complete Blood Count contains a large amount of data about the cellular makeup of blood. Because there is so much information, it helps to assess the data in an organized and systematic manner. By examining specific groups of results together, you can more easily identify abnormal or interrelated results.
- Integrate quantitative and qualitative data
- Start from the most significant abnormality
- Grade the abnormalities (mild, moderate, marked)
- Consider species variations
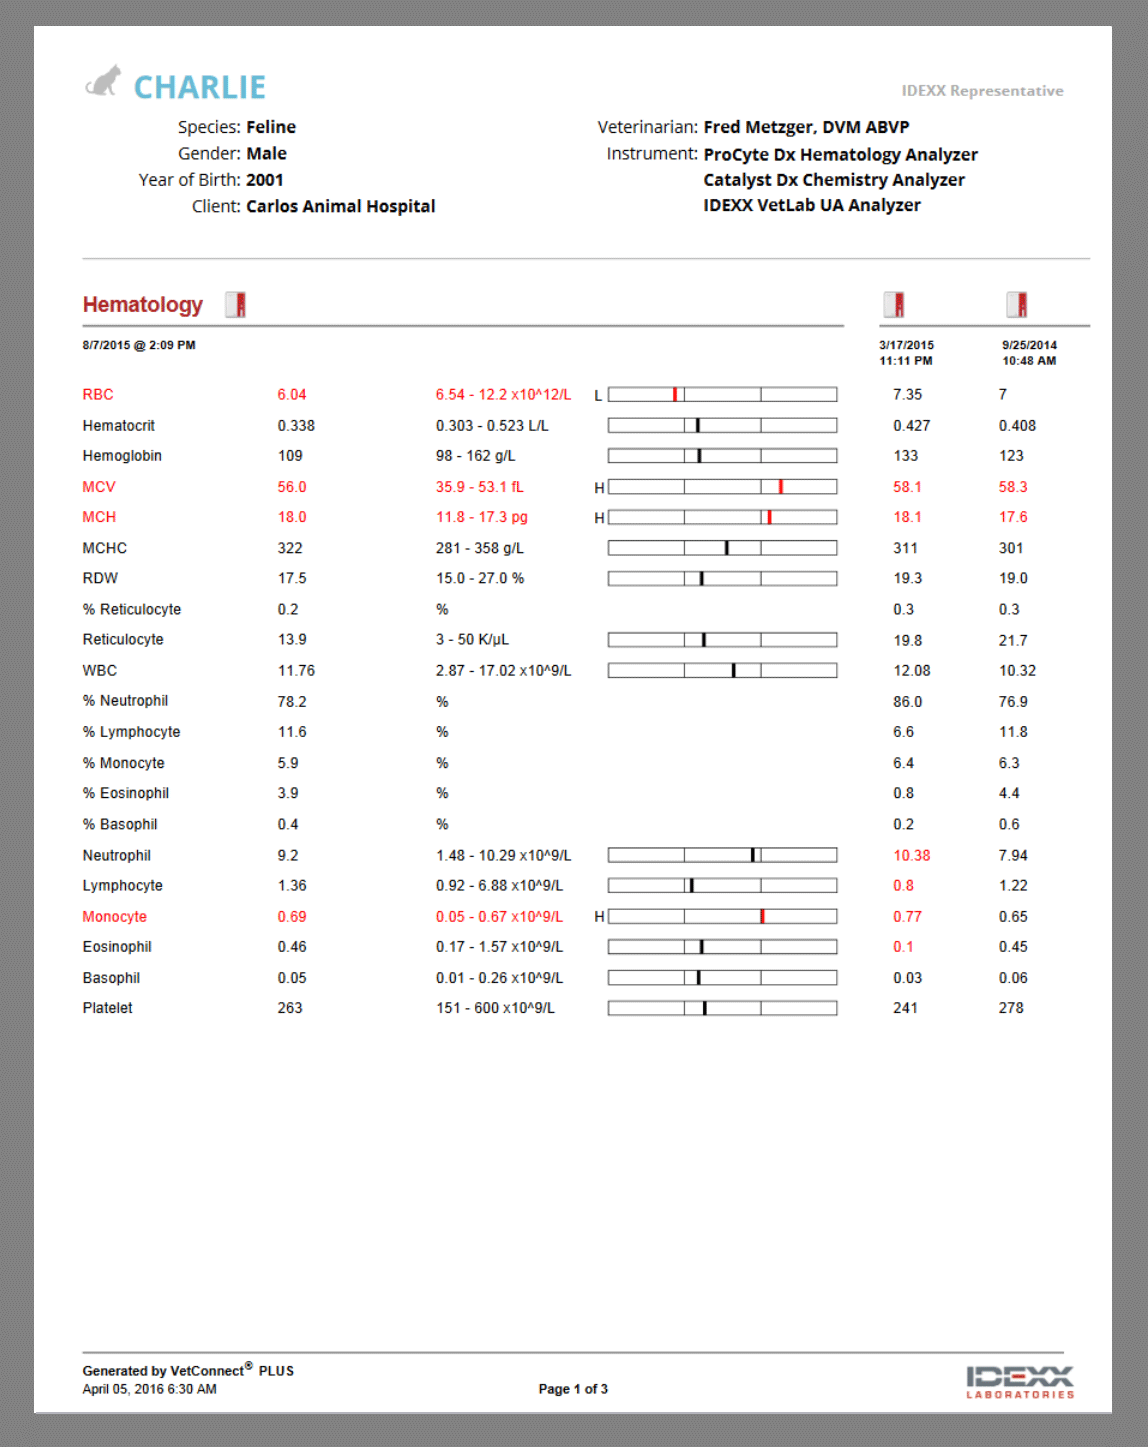
Below is a sample Complete Blood Count report generated using ProCyte Dx. Download the attached pdf and find out what information each of the parameters reveals as part of the Complete Blood Count and how the results can be interconnected:
